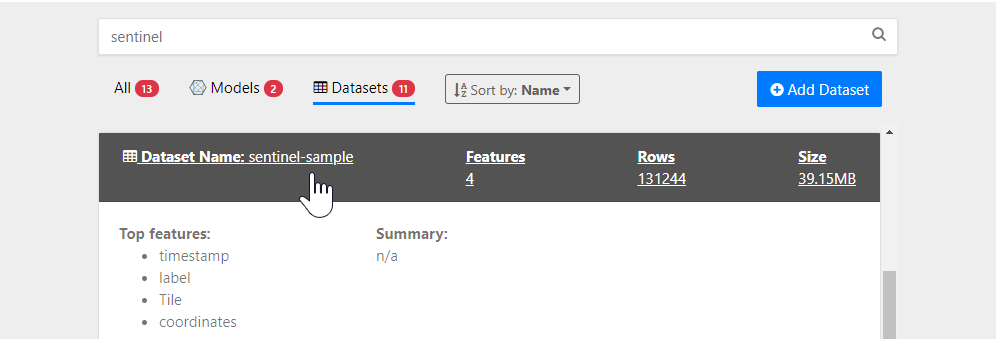
To start working with the satellite imagery tile data, search for sentinel in the Select Model or Dataset view and click the sentinel-sample dataset.
Add a label to the dataset
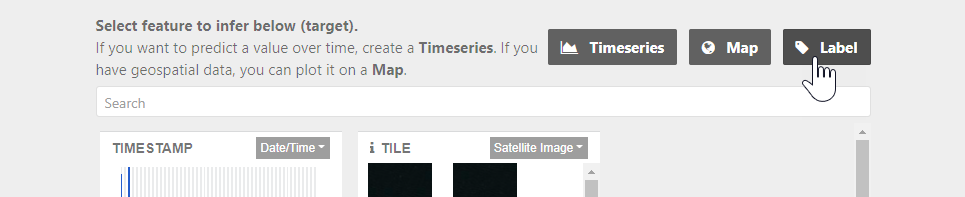
In the New Model: Select Target view, you can add a label to your dataset and identify some samples that contain positive and negatives examples of the terrain you’re trying to predict (snow).
- Click Label.
-
In the Label Creation dialog, enter a name for the label you want to add (e.g. Snow).
The new label appears above the list of features on the left and indicates that all samples in the dataset are currently unlabeled.
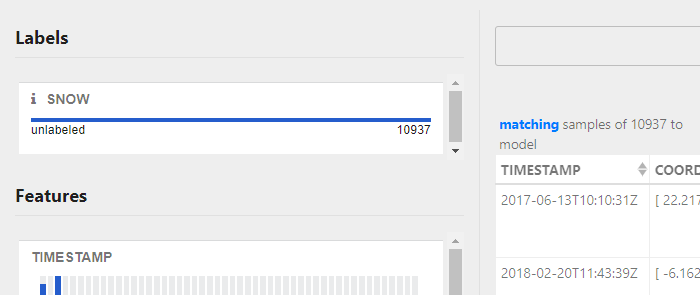
- Use the Samples table to identify and label examples of tiles that contain snow:
- Click samples containing tiles that depict snow to select them.
-
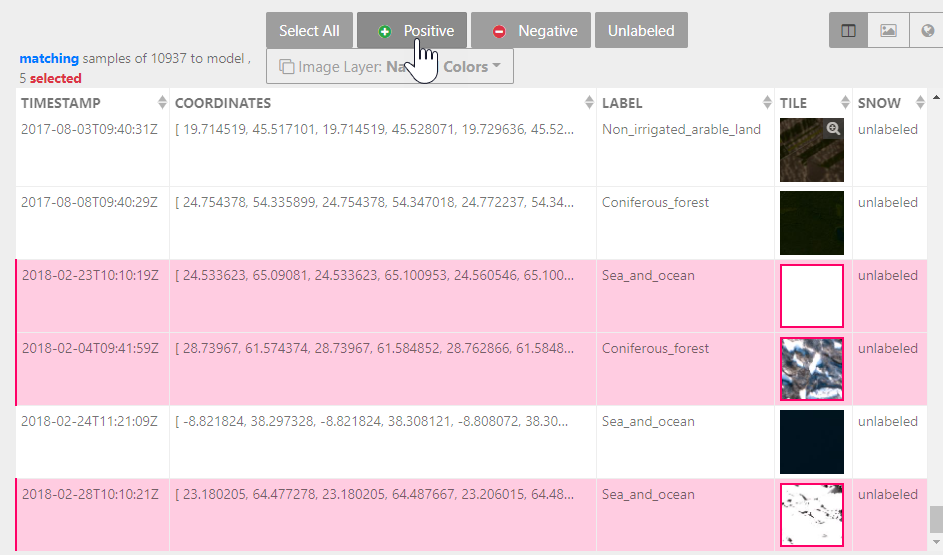
Once you have selected a number of samples, click Positive to label them.
There are several ways you can inspect the terrain of tiles in your data:- Hover over a tile and click to expand it. Here you can:
- View the tile at full size.
- Increase or decrease the Brightness of the tile to bring out details that may not be visible in the normal display.
- Upscale the image to enhance the resolution.
- Change the Image layer to view a different satellite image band that is more sensitive to the terrain you're looking for.
- Adjust the Samples table layout:
- Click to view just the tiles without any of the other features in your dataset.
- Click to view where the tiles are located on a geographic map.
- Filter the samples using the other features in the dataset.
- Follow the previous step to also select and label examples of tiles that do not contain snow. In this case, click Negative to label them.
Note: To proceed to the next steps, you must label at least one positive and one negative example.
Refine your positive and negative examples
At this point, you can use the samples you’ve already labeled to search for more positive examples. Search Similar uses your labeled input to rank the remaining unlabeled samples in terms of how confident the system is that they contain target terrain type (snow).
- Click Search Similar.
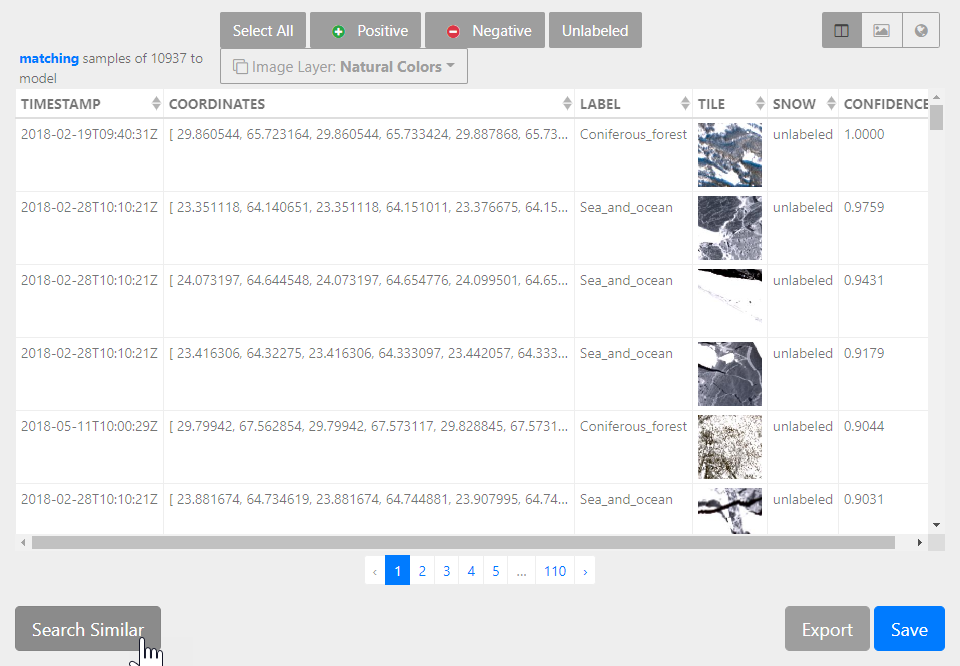
Note that now, the Samples table is sorted by a new Confidence column on the right. Based on your previous labeled input, samples at the top of the list are ones that the system determines are most likely to contain your target terrain (snow).
-
Repeat steps 3–4 above to add more positive and negative examples.
Filter the Confidence chart on the right by clicking and dragging a selection around areas of interest. To find potential negative examples, focus on the left side of the chart (low confidence). To find potential positive examples, focus on the right side (high confidence).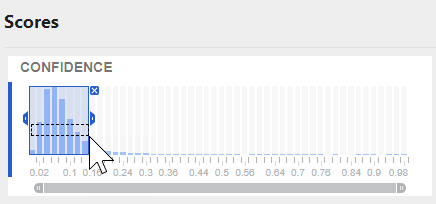 Tip: If a high number of the samples in the table are either positive or negative, click Select All and then individually deselect any samples that don’t match.
To build a large enough set of labels, repeat the process of labeling positive and negative examples and then using Search Similar as necessary. Each time the system should be better at identifying positive examples, allowing you to quickly build your training data.
Save the dataset
Once you have labeled a sufficient number of positive and negative examples, you can save your dataset. Saving the dataset makes a copy of the original dataset with:
- Your new label feature consisting of your positive and negative examples
- All unlabeled samples removed
Note: Unlabeled samples are removed from the saved dataset so you can use it to train a model to predict your target terrain. Any unlabeled samples would not be useful for this process.
To save your dataset:
- Click Save, enter a unique Dataset Name and click OK.
- Click Go Back to Select Target Page to begin training your model.